Article: Silver, I. A., Philbrick, S., Dawes, D., Kluckman, M., & Tueller, S. (2026). Can Structured Detention Screening Reduce Admissions to the Juvenile Legal System?: Evaluating the Impact of the Detention Assessment Tool (DAT). Youth Violence and Juvenile Justice, https://doi.org/10.1177/15412040261489536
Background (PDF):
Actuarial assessments have a longstanding history within the criminal legal system. These assessments provide important information about the individuals being served to practitioners, guiding evidence-informed decisions about treatment, supervision, and confinement. Detention assessments (one subset of criminal legal system assessments) provide court officials with an understanding of the risk an individual poses to the community, helping them make evidence informed decisions about community supervision or, if necessary, placement into a correctional facility. While various detention assessments exist, the North Carolina Division of Juvenile Justice and Delinquency Prevention (NC JJDP) relies on the Detention Assessment Tool (DAT) to guide these decisions.
The DAT is an evidence-informed actuarial assessment designed to help juvenile justice and juvenile court counselors decide if a youth should be detained before, during, or after trial. The DAT relies on both static and dynamic factors to develop a detention recommendation. An example of a static factor, one not subject to change, is “prior adjudication for A-E felony”, while an example of a dynamic factor, one that could be subject to change, is “currently under the influence of drugs/alcohol or known history of substance use.” Empirical research on the DAT has been limited to date, but theory suggests it might be effective at informing detention decisions. This is because prior research suggests that the use of actuarial assessments can help identify individuals with an elevated likelihood of posing a risk to the community when released.
The widespread implementation of the DAT was intended to: 1) to reduce unnecessary or inappropriate secure confinement of children, (2) to reduce crowding and to improve conditions for children in secure detention facilities, (3) to encourage the development of non-secure alternatives to secure juvenile confinement, and (4) to discourage failures to appear in court and subsequent delinquent behavior.
Briefly, the initial DAT was developed and implemented in 2012 with a DAT 2.0 being developed and implemented in 2021. The current study sought to understand how the implementation of the DAT coincided with changes in detention admissions (per 100 delinquent complaints) across North Carolina’s 100 counties. The research questions were:
- Was the initial implementation of the DAT in 2012 associated with an immediate and long-term reduction in detention admissions (per 100 delinquent complaints) across NC (from 2012-2021)?
- Was the implementation of the DAT 2.0 in 2021 associated with an immediate and long-term reduction in detention admissions (per 100 delinquent complaints) across NC (from 2021-2024)?
- One additional question was asked: Do detention admissions (per 100 delinquent complaints) correspond with violent crime complaints (per 100 delinquent complaints)?
For the current study, the detention admissions per 100 delinquent complaints at the county-year level was calculated as the number of detention admissions for the county each year divided by the number of delinquent complaints for the county each year multiplied by 100. “C” in the equation below is county, “Y” in the equation below is year.

Figure 1 provides the distribution of detention admissions across North Carolina’s 100 counties from 2004-2024. The initial implementation of the DAT occurred in 2012 (blue area), with the DAT 2.0 being implemented in 2021 (the start of the green area). It can be observed that most North Carolina’s 100 counties have reduced their detention admissions (per 100 delinquent complaints) over time, with substantive reductions occurring after 2012. Some counties, however, do appear to have a higher rate of detention admissions when compared to other counties.
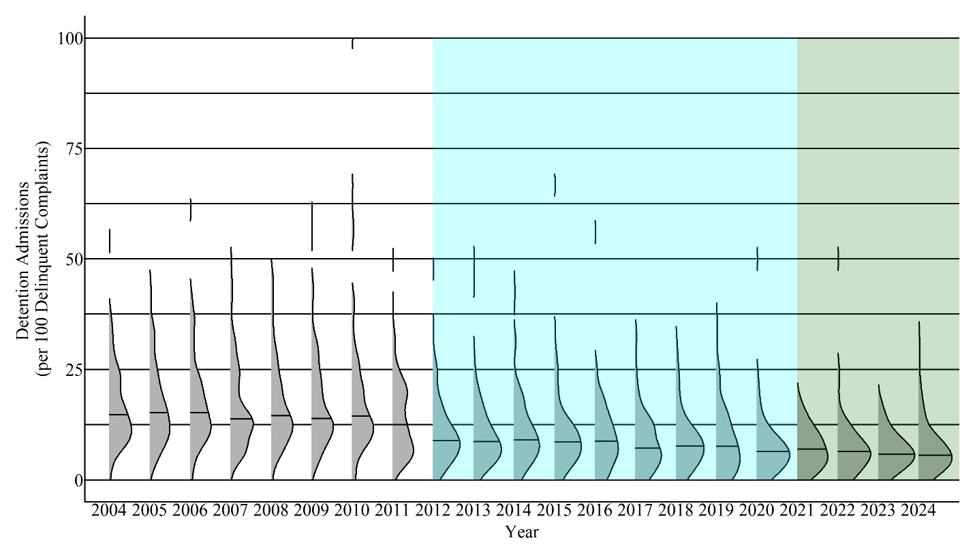
Notes: The median county for detention admissions has declined substantively over the past 20-years, with only a limited number of counties having more than 15 detention admissions per 100 delinquent complaints.
Primary Results:
The results in Figure 2 illustrated that the first implementation of the DAT resulted in an immediate -5.23 case reduction in the detention admissions per 100 delinquent complaints which was sustained over time. For example, if on average 15 cases were detained (per 100 delinquent complaints) before the initial implementation of the DAT (across NCs 100 counties), only 10 cases were admitted to detention (per 100 delinquent complaints) after implementing the DAT. The continued usage of the DAT did not appear to further reduce the detention admission rate over time (2012-2020).
The implementation of the DAT 2.0 did not appear to immediately reduce detention admissions or result in a reduction in detention admissions over time. Detention admissions per 100 delinquent complaints remained largely consistent with the pattern observed after the initial implementation of the DAT.
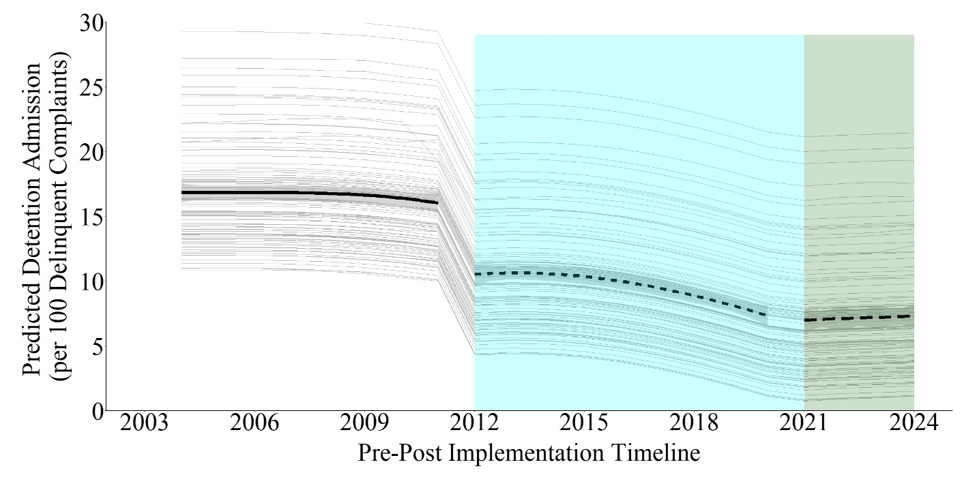
Notes: The results presented in this figure are based on a multi-level ITS model.
Supplemental Results:
In addition to the primary analysis, supplemental scatterplots were produced to evaluate if counties were experiencing more violent complaints (per 100 delinquent complaints) than detention admissions (per 100 delinquent complaints), about the same number of violent complaints and detention admissions, or more detention admissions than violent complaints. These scatterplots were produced for 2021-2024 (succeeding the implementation of the DAT 2.0).
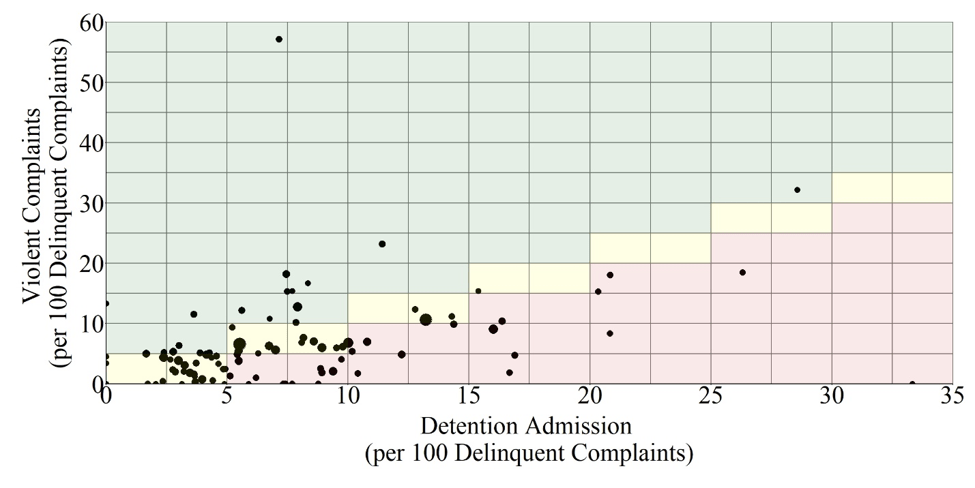
Figure 3 shows the results for 2024, where the green region identifies the counties that had more violent complaints than detention admissions, the yellow region identifies the counties that had about the same rate of violent complaints and detention admissions, and the red region identifies the counties that had more detention admissions than violent complaints.
Overall, the detention admission rate appeared to be positively associated with the violent complaint rate (i.e., the higher the violent complaint rate, the higher the detention admission rate). For example, a county with 10 violent complaints per 100 complaints often had a higher number of detention admissions per 100 complaints than a county with 5 violent complaints per 100 complaints. However, there were some large differences between counties.
Some counties appeared to have a higher rate of detention admission than rate of violent complaint. For example, one county had 19 violent complaints (per 100 delinquent complaints) but 26 detention admissions (per 100 delinquent complaints). Other counties appeared to have a higher rate of violent complaint than the rate of detention admission. For example, one county had 24 violent complaints (per 100 delinquent complaints) but only 13 detention admissions (per 100 delinquent complaints).
Notes: The results presented in this figure are based on a multi-level ITS model.
Implications:
The results of the current evaluation yielded findings that the initial implementation of the DAT appeared to reduce the detention admission rate. Furthermore, detention admissions appeared to be positively associated with violent complaints. Overall, these findings strongly suggest that the implementation of the DAT achieved it’s intended goals. The positive association between violent complaint rate and detention rate suggests that the use of detention in NC has improved, with the inappropriate or unnecessary use of detention has been reduced. Importantly, detention admissions have remained substantively lower since the initial implementation of the DAT (2012-2024) when compared to pre-DAT implementation (2004-2011).
Additionally, one expected benefit of the DAT was that more consistent detention decisions would be made across all counties. However, despite all of the positive findings, improvements could be implemented to reduce the observed differences in detention admissions across North Carolina’s 100 counties. Some preliminary recommendations include:
- Conduct routine DAT fidelity checks to ensure consistent application of the tool across counties.
- Increase DAT training for juvenile justice and court officials, focusing on maintaining fidelity to the DAT model. One training model could be:
- Initial DAT training – define concepts, review scoring, testing, test implementation.
- Monthly online review – brief DAT scoring vignettes and review
- Semi-annual or annual review training – in-person case reviews (5-10 cases)
- 5-year refresher trainings – full initial DAT training again
- Training should highlight that the DAT is a validated tool. As such, juvenile justice and court officials should keep overrides to a minimum, using them in extraordinary circumstances. Additionally, override monitoring could maintain the consistent application of override practices and, when necessary, suggest that an individual should participate in refresher training on the appropriate use of overrides.
Methods:
This study used County Databooks available on https://www.ncdps.gov/our-organization/juvenile-justice/research-and-reports#CountyDatabooks-5368, which provides county level detention and complaint data for NC DJJDP from 2004 to 2024. The data was manually cleaned by Dr. Silver and merged with Census and COVID data. The code for cleaning and analyzing the data can be made available upon request.
A random-intercept interrupted time series (ITS) model was used to estimate immediate and lasting changes in the detention admission rate (per 100 delinquent complaints) following the implementation of the initial DAT and the DAT 2.0. Models adjusted for other policy changes (e.g., “Raise the Age” legislation), COVID-19 disruptions, and total juvenile population. Robustness checks included spline adjustments for time trends, visualizations of predicted outcomes, and variance prediction models.
Disclosure: This research brief was prepared by Ian A. Silver, Sarah Philbrick Debbie Dawes, Marianne Kluckman and Stephen Tueller

