For the sixth misidentification, we regressed X1 on EX31-EX33, Y1 on X1 and LEN1-LEN4 using Lavaan (illustrated in the Figure below). This was replicated 10,000 times – using R-loops – while randomly varying the effects for each causal pathway between the constructs in the network excluding the direct effect of X1 on Y1 (true direct causal effect = 1.00; N = 10,000; R-Code).
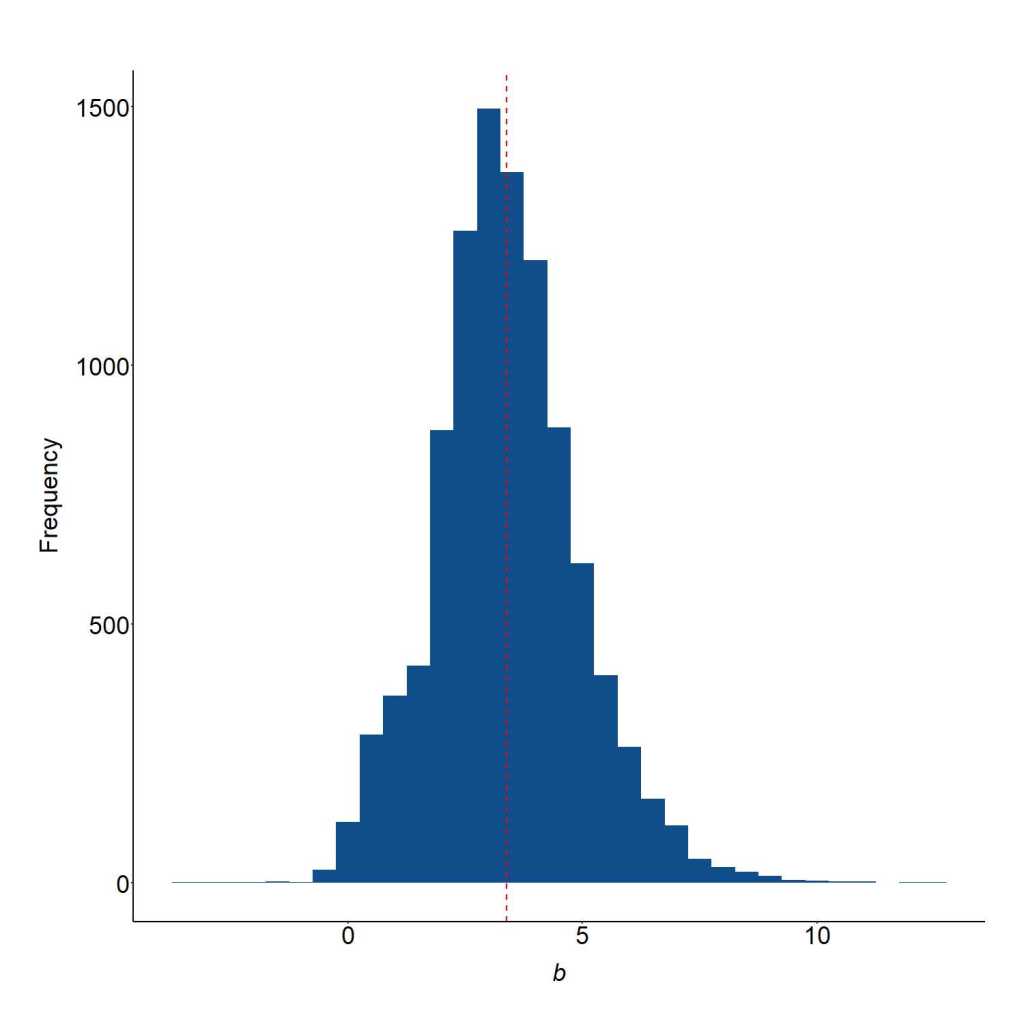
As illustrated in the figure below, the misidentification of the structural association where X1 on EX31-EX33, Y1 on X1 and LEN1-LEN4, produced an average slope coefficient of b = 3.387 for the relationship between X1 and Y1. This suggests that a 1 point increase in X1 directly causes a 3.387 increase in Y1, on average. Considering the past models, this is extremely close to the true direct effect of X1 on Y1 (As a reminder, the true slope coefficient is 1.00).